Summary: XGBoost and ensembles take the Kaggle cake but they’re mainly used for classification tasks. Some tools like factorization machines and vowpal wabbit make occasional appearances.
Algorithm Frequency
An important question we can ask this data set is “What tools” are being used. And we can answer this question, better than my original anecdote driven method.
In the table below, I list the term I searched for, the frequency of that term being referenced, the number of competitions it is referenced by, and then the type of competition it was used in. I broke the 33 competitions into classification (21 competitions), ranking (5), and numeric prediction (7) tasks.
          term freq comps class_comps rank_comps numeric_comps
       xgboost   76    16          11          3             2
      ensemble   44     8           5          2             1
           gbm   23     8           2          2             4
           knn   20     6           4          0             2
        neural   19     7           5          0             2
    regression   18     8           2          1             5
           ffm   16     3           3          0             0
           svd   16     2           1          1             0
      boosting   14     9           4          2             3
        forest   10     7           3          1             3
 factorization    8     4           2          1             1
      logistic    7     6           6          0             0
           pca    7     2           2          0             0
           svm    7     3           3          0             0
      adaboost    6     4           4          0             0
         lasso    6     2           1          1             0
    clustering    5     4           2          1             1
         ridge    4     3           1          1             1
        libffm    3     2           1          1             0
        vowpal    3     3           2          0             1
         libfm    2     2           2          0             0
I used the tm package from R which does not use ngrams. As a result, I had to use terms like “forest” instead of “random forest”. So there may be some cross contamination but there’s still good directional material here.
Ultimately, xgboost and ensembles are the most important tools in a Kaggler’s toolbox. However, it’s mostly due to the classification tasks that are most common on Kaggle.
Another important set of tools are factorization models. That includes libfm, libffm, and ffm. They appear in six different competitions (4 classifications, 1 ranking, and 1 numeric).
Important Associations

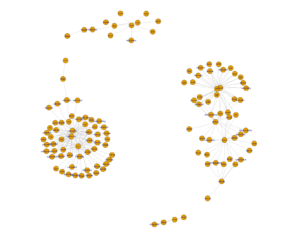
See the relationships between algorithms and related terms (r = 0.90). Caution: Linked to a big png.
With all this data, I was able to visualize the relationships between some of the algorithms and the terms that were being used. (Hat Tip to Katya Ognyanova for her network visualization in R tutorial).
This is a lot of data, so I kept it only to highly correlated terms (r = 0.90) which cuts out some of the interactions between algorithms. At the very least, the plot above shows a few relationships between PCA and Neural Networks, Lasso Regression and Keras (which is a little surprising), and SVD + Ensembles + Regression all seem to mingle together in the bottom left corner.
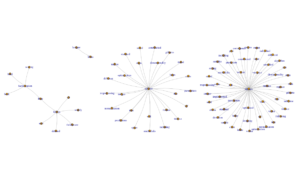
To dig a little deeper, I blew out the three sets of algorithms / tools: factorization machines, xgboost, and SKLearn.
If you click on the image above, you can see that factorization machines (which only had three instances) has some relationship to lasange, CTR, and fieldaware topics.
xgboost has some more discussion around process, which includes normalization, preprocessing, feature, and parameters. With such a small sample size (16 documents), it’s not surprising to see that one person referenced some contributors and they show up as highly correlated terms.
Lastly, sklearn has a lot going on with it. This is believable since sklearn has so many features and it’s the de facto tool used by data miners working in python.
Without more data, it seems the network visualizations have limited insights to provide.
Competition Document Stats
The 33 Kaggle competitions I looked at were taken from public forum posts, winning solution documentations, or Kaggle blog interviews by the first place winners.
As a result, there’s a lot of variance. Some Kagglers might share a lot, others might share a little. Official documentation carries a different writing style than a forum posting.
These are the results after removing stopwords but not stemming or decreasing the sparsity of the document-term matrix.
Each document has a suffix which indicates what kind of modeling task is being done: class = classification, numeric = numeric prediction, and rank = ranking of results (typically search engine results).
                                 docs word_freq token_count
                airbnb_new_user_class       191         118
                       allstate_class       321         202
               avito_ad_context_class       406         212
                 avito_dupe_ads_class       707         418
           avito_prohib_content_class       378         257
                  belkin_energy_class       233         145
                      bnp_claim_class       383         251
             caterpillar_tube_numeric       158         121
                       census_numeric       760         455
           coupon_purchase_pred_class        47          45
                criteo_ctr_pred_class       187         111
              crowdflower_search_rank      2146         718
                       ctr_pred_class       291         147
           dato_sponsored_pages_class        59          49
                    dunnhumby_numeric       314         183
                      event_reco_rank       110          85
                   expedia_hotel_rank       332         219
                expedia_icdm2013_rank       106          74
                    fast_iron_numeric       238         146
            home_depot_relevance_rank        89          71
                 homesite_quote_class       203         163
              icdm_cross_device_class       273         161
imperial_college_loan_default_numeric       145         101
               imperium_insults_class       113          87
                     ms_malware_class      1017         423
         online_product_sales_numeric       122         106
             otto_group_product_class       526         212
                prudential_life_class       323         212
                rossman_store_numeric       906         429
          satander_satisfaction_class      1314         554
                  shopper_value_class       217         155
                     springleaf_class        44          39
                    stumbleupon_class       192         148
For example, the springleaf forum post was simply this:
(1) category features: use likelihood to encode it, the way how you do is important, it’s easily leaky. I use a cross validation to do it.
(2) logistic regression: feed it’s prediction into xgboost. it’s similar to likelihood features.
(3) feature engineering: only location and date work.
(4) tuning parameters: best paramter I got: max_depth=18 colsample_bytree=0.3 min_child_weight=10 subsample=0.8 num_round=9666 eta=0.006
(5) merging different xgboost’s model by using different features and paramters.
Bottom Line: If you’re going to spend time on Kaggle, it’s important to choose models that are tuned for the task at hand. Choose XGBoost for classification. Try Factorization Machines for sparse and classification data. Consider gradient boosting if you’re working on numeric predictions.
