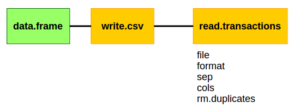
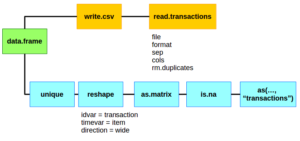
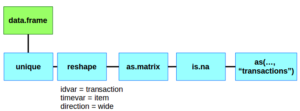
Summary: The simplest way of of getting a data.frame to a transaction is by reading it from a csv into R. An alternative is to convert it to a logical matrix and coerce it into a transaction object.
I occasionally use the arules package to do some light association rule mining. The biggest frustration has always been getting my data into the “transactions” object that the package expects. This usually requires a great deal of Googling and revisiting Stack Overflow posts.
I am putting an end to that by writing a clear tutorial on how to get your data.frame into a transaction. First, we’ll create an example data set and then I will show you the two methods of creating that transaction object.
Example Data and Prep
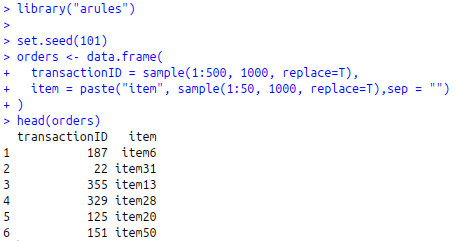
library("arules")

set.seed(101)
orders <- data.frame(
  transactionID = sample(1:500, 1000, replace=T),
  item = paste("item", sample(1:50, 1000, replace=T),sep = "")
)
The set.seed function is used to let you follow along at home and get the same results.
The data.frame code…
- Generates a random sample of transaction IDs (between 1 and 500).
- Generates random items with IDs between 1 and 50.
- The random item IDs will have the word “item” in front so we can easily tell transaction IDs from item IDs.
- 1,000 elements are generated for transactions and items.
You should now have a data.frame called orders.

Using read.transactions to transform your data.frame

The first, and most common, way of getting a data.frame to a transaction object is to write it to a csv and then read it back into your R environment with read.transactions.
# Using a CSV ####
# Create a temporary directory
dir.create(path = "tmp", showWarnings = FALSE)

# Write our data.frame to a csv
write.csv(orders, "./tmp/tall_transactions.csv")

# Read that csv back in
order_trans <- read.transactions(
        file = "./tmp/tall_transactions.csv",
        format = "single",
        sep = ",",
        cols=c("transactionID","item"),
        rm.duplicates = T
)
summary(order_trans)
In this code block, we create a temporary directory using the dir.create function to store our csv.
We then write to that directory a csv version of our data.frame.
Lastly, we bring it back into R with read.transactions and we just have to specfiy a few parameters to make sure it reads it in correctly.
- format = “single” – This says there will only be two columns in the csv, a transaction id and an item id.
- sep = “,” – This tells the read function that we are working with a csv. You could specify any delimiter.
- cols=c(“transactionID”,”item”) – Since we are using the single format we have to give the column headers. They must be transaction and then item column names.
- rm.duplicates = T – This will drop any duplicate items found in a transaction. If your data set is large and already unique, it’s better to set this to FALSE to avoid extra scanning of the data.
When we call the summary function on our transaction object (order_trans) we get something that looks like this:
transactions as itemMatrix in sparse format with
 449 rows (elements/itemsets/transactions) and
 50 columns (items) and a density of 0.04360802

most frequent items:
 item31  item22  item29  item34  item38 (Other)
     29      27      27      27      27     842
We’ll see if we can match that using the next method below.
Coerce a data.frame / matrix to a transaction object using as()
If your data.frame has a huge number of items and orders, you may not want to spend the time reading it and writing it and then reading it back into memory. The alternative to this is converting your data.frame into a transaction directly in R. We first need to reshape the data.frame into a wide format and then convert it to a logical matrix.
# Converting to a Matrix ####
orders$const = TRUE

# Remove duplicates
dim(orders) #1,000 x 3
orders <- unique(orders)
dim(orders) #979 x 3
This first section of prep work creates a variable called const that contains all TRUEs. This will be the value inside of our matrix that we are about to create. The other two variables, transactionID and item, will be our row and columns, respectively.
In this same snippet, we create a unique set of transaction and item combinations. This mimics the behavior of rm.duplicates in read.transactions and prevents some warnings later on.
# Need to reshape the matrix
orders_mat_prep <- reshape(data = orders,
                             idvar = "transactionID",
                             timevar = "item",
                             direction = "wide")

# Drop the transaction ID
order_matrix <- as.matrix(orders_mat_prep[,-1])

# Clean up the missing values to be FALSE
order_matrix[is.na(order_matrix)] <- FALSE
Using the default reshape function we can go from a tall to wide data.frame.
- idvar = “transactionID” – This will be our unique row variable.
- timevar = “item” – This will be our unique column variables.
- direction = “wide” – We want a wide dataset, not a tall one.
Had we not created a unique dataset we would have ended up with a set of warnings alerting us to the duplicates.
You should end up with a table that looks like…

Then the transaction id is dropped (column 1 in our data.frame) since it no longer has any purpose. The row itself is that transaction and we don’t need to analyze anything going back to the original transaction ID. The drop is done at the same time we are converting the data.frame to a matrix using as.matrix.
Finally we fill in all of the NA values with FALSE.
This next step is optional but makes things look nicer.
# Clean up names
colnames(order_matrix) <- gsub(x=colnames(order_matrix),
                               pattern="const\\.", replacement="")
From a style perspective, I don’t want to look at associations that look like “const.item1”. Using the gsub function, we can replace the text “const.” with nothing. You’ll notice the pattern contains “\\.”
- The period symbol is a special character in regular expressions.
- We have to “escape” the character with a backslash (\) to prevent its special behavior.
- But the backslash is a special character in R and it too must be escaped with another backslash (\\)
After overwriting the column names, we get to the point of this mini-tutorial and use the as function to convert our
order_trans2 <- as(order_matrix,"transactions")
When we run summary on order_trans2, we should get the same results as from before:
transactions as itemMatrix in sparse format with
 449 rows (elements/itemsets/transactions) and
 50 columns (items) and a density of 0.04360802

most frequent items:
 item31  item29  item22  item38  item34 (Other)
     29      27      27      27      27     842
Identical! Now you know two ways of getting your data.frame into the arules transaction object format.
Bottom Line: The simplest way is probably working with the csv and loading your transactions back in. But if your data is so large and reading from disk is so slow, you can always convert it into a wide matrix.

