Summary: Writing better quality data mining code requires you to write code that is self-explanatory and does one thing at a time well. In terms of analysis, you should be cross-validating and watching for slowly changing relationships in the data.
Methodology Quality
Even before you think about writing a piece of code, you should be making sure you’ve explored the concepts you’re working with.
Have a Hypothesis and a Plan
Follow the scientific method when doing an analysis. You should think about what variables you think might be important and how you’re going to approach working with the data.
Cross-Validated

If you’re not running cross-validation, you’re not writing quality models. You’re making an overfitted guess.
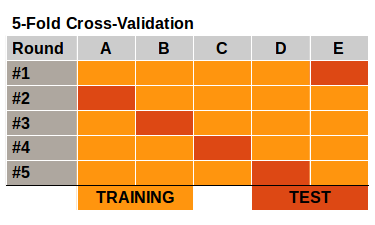
It requires a little bit more code but it prevents you from having the illusion of success. When you perform cross-validation, you…
- Train a model on a portion of the data.
- Check its performance on the remainder holdout.
- Repeat the process for K partitions of the data.
- Average the performance across the K holdouts.
- This provides you with an unbiased evaluation of the model.
Even if you create a single validation set (i.e. train on 70% and validate on 30%), you’re still only getting a single estimate of the model’s performance on unseen data.
More estimates = Better understanding
Repeatable Results
Once you’ve trained a model you will likely need to do it again. Whether it’s just predicting on new data or rebuilding your model on new training data, you will have to run your code at least one more time.
It’s important to have your code clean and organized in a linear way. A big portion of that is having an analysis framework. But at a more granular level, you should…
- Set your random seeds before running your models.
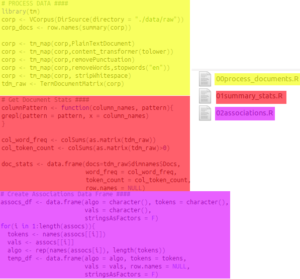
- Avoid giant single file scripts.
- Each script should do one thing or be one stage of processing or analysis.
- You should have a logical sequence of steps so anyone could run your code.
- Consider having a main script that pieces all the other parts together.
Watching for Slowly Changing Relationships

Depending on how often you are going to run this model – is it a one time campaign or is it an ongoing scoring – you may need to watch and see if the attributes that are important continue to be so.
For example, let’s say you’re working on predicting who will purchase your best-selling t-shirt design. You create your model, perform cross-validation at every step of the way, and your code is written in a repeatable system. Now you implement and let it ride.
Eventually, the model stops performing as well as it used to. That top decile of performance is now closer to the second and third decile. You can retrain your model now but without looking at what has changed over time, you are losing a lot of powerful insights.
Option #1: Record Everything
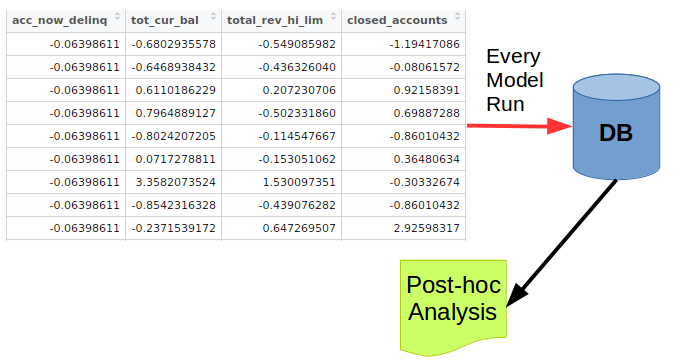
The best case of capturing the slowly changing relationships between the data and the model would be to capture every input and output variables at the time of re-running your model. In addition, you would capture the response and meta information about that response (e.g. time between responding, value of response, type of response).
Having all this input, you can plot, over time, the changes in each attribute. For example, for a variable like sales, perhaps there’s a point in time where all prices are increased. That has a two-fold effect.
- The “scale” of any pricing coefficient is off.
- The type of customer buying may be completely different (higher-end buyers vs low-end).
With all of this data easily available, you can start training a new model and validate it against different snapshots of your historical data with ease.
Option #2: Logging Key Relationships
In a more realistic world, you can’t store everything. The alternative is to write to a log file each time you re-run your model. I would store things such as…
- Correlations and Interactions with key variables.
- Validation Set error rates.
- Top and bottom 100 predictions (and their input values for key variables).
- Predictions for key customers.
In the end, you should have one script that outputs / appends to a log file after the model predictions have been created.
You need both hard numbers and anecdotes when approaching business leadership. While it shouldn’t be a hard sell to update a model, there’s always risk in changing something that has a history of working.
Code Quality
Assuming the way you’ve organized your analysis is done well, there’s a whole other world of keeping your code clean and understandable. This is an area that a lot of software developers have written about but not a lot of business analysts are used to.
Write More Functions: DRY Principle

When writing a series of analyses, we often write lots of repeated code.
- Plotting similar graphs for a set of variables.
- Transforming data into new variables.
- Pulling data from an API
- Evaluating prediction performance.
All of these concepts could be wrapped up into functions that let you avoid the hassle of making a change in one version, only to repeat that change multiple times.
Your code can be cleaner and the thing you’re trying to do made more apparent by writing a clearly named function to do it.
Write Clear Names
Comments are the enemy. I never realized it before but writing a comment in your code is giving up.
Your code should be self-explanatory and not need any further explanation. Comments are useful when you’re explaining a difficult concept or using a function that might not be standard for the future developers editing your code.
Split Your Code Apart
Do not write one single program! It’s critical for reproducibility and accuracy of code that you have programs that do one thing.
This separation of concerns let you focus on doing one thing well at a time.
It’s easy to write everything in one file and it’s lazy. As a result, you end up with some file that is hard to understand and unworkable if one part stops working.
Create a Style Guide
When working in a team you need to agree on a set of coding practices such as function and variable capitalizations (e.g myFunction and some_variable). In addition, you should find a directory structure that makes sense to you both.
It can be a real pain to share models or processing steps and have to convert between styles.
Don’t feel comfortable with your own style? Borrow from others:
- Google has an R and Python style Guide.
- Try following the Python official style guide.
- Hadley Wickham has some strong opinions on R style.
Use Version Control Software
To avoid the frustration of making copies of your programs and making one change and breaking everything, use a version control tool like git.
Software developers have been using these tools for decades. It’s time for business analysts to catch up.
There are some great free tutorials on git.
Bottom Line: Think about what you’re writing before you write any code. Think about how you’ll make sure it’s accurate (cross-validation) and how someone else (or you) can pick up the code and start using it right away.
