Yearly Archives: 2016


Always Have a Baseline

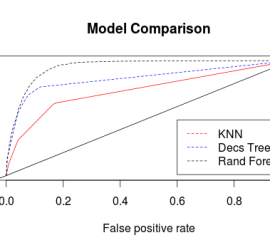
Summary: Always check your numbers with smaller, simpler queries and figures.  Use total sales as a reality check for comparison to sales queries.  When creating models, compare performance to a simpler model.  Don’t assume complexity equals accuracy.  Be prepared to compare against existing “gold standard” models.

ROC Curve Example Plot from ROCR package

Meet-Up Recap: Data Science at Scale with Spark

Summary: Dean Wampler from Lightbend presented at the Direct Supply MSOE offices on Tuesday, 4/5/2016.  Dean covered a high-level overview of Spark and its benefits (business logic is focus of code and it’s faster).  Those wanting to learn more should pick up Learning Spark at O’Reilly books.

Dean Wampler at Data Science at Scale with Spark

Core Elements of Reports

Build a Reporting Swipe File

Summary: Building a repository of good report components helps you quickly assemble reports that work.  Typical things to watch for are: Opening statements, summary sections, key takeaways, useful dimensions and metrics, and recommendations.


Text Mining Packages and Options in R

Summary: The tm and lsa packages provide you a way of manipulating your text data into a term-document matrix and create new, numeric features.  The ngram package lets you find frequent word patterns (e.g. “The cow” is a bi-gram or 2-gram; “The cow said” is a tri-gram or 3-gram).  Lastly, for a quick visualization (though […]

Wordcloud generated in R for Brother's Grimm Stories